
Assess your engineering operating system
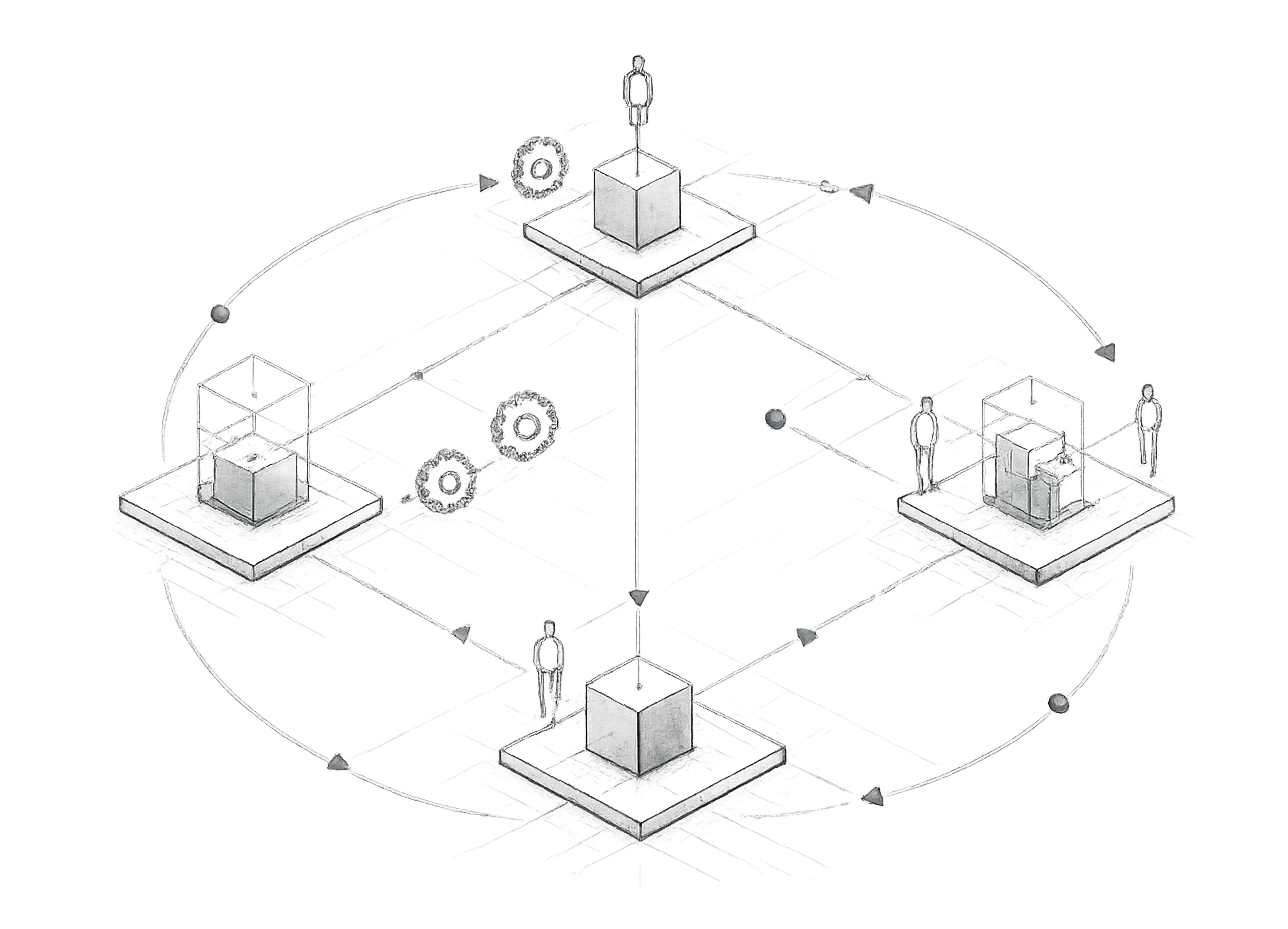
Engineering organisations rarely lose performance through lack of capability alone.
Breakdown occurs when ownership, governance, operational cadence and lifecycle coordination no longer remain coherent as complexity increases.
Reliable delivery is structural before it is operational.
01
OPERATING RHYTHM
Is your operating rhythm aligned to real conditions?
Is your planning cadence aligned to operational reality?
Do reviews occur at the right time, not just regularly?
Are information flows consistent across functions?
Does the system adapt when conditions change?
Are commitments realistic and achievable?
Is escalation occurring before or after operational impact appears?
Rhythm creates clarity; misaligned rhythm creates rework and escalation.
02

LIFECYCLE COHERENCE
Is lifecycle coherence maintained end to end?
Is ownership clear from concept through to operation?
Are requirements traceable across all stages?
Do changes flow through the lifecycle early enough?
Is downstream impact understood before release?
Is handover planned or assumed?
Does operational feedback influence upstream decisions?
Coherence reduces surprise and protects delivery confidence.
03

CROSS FUNCTIONAL ALIGNMENT
Are functions aligned to shared outcomes?
Are engineering, operations and commercial priorities aligned?
Are supplier and partner interfaces clearly defined?
Is manufacturing readiness considered early?
Do teams solve problems together or in sequence?
Are shared outcomes visible across functions?
Does escalation increase when pressure rises?
Alignment reduces friction; misalignment moves risk downstream.
04
RELEASE CONFIDENCE
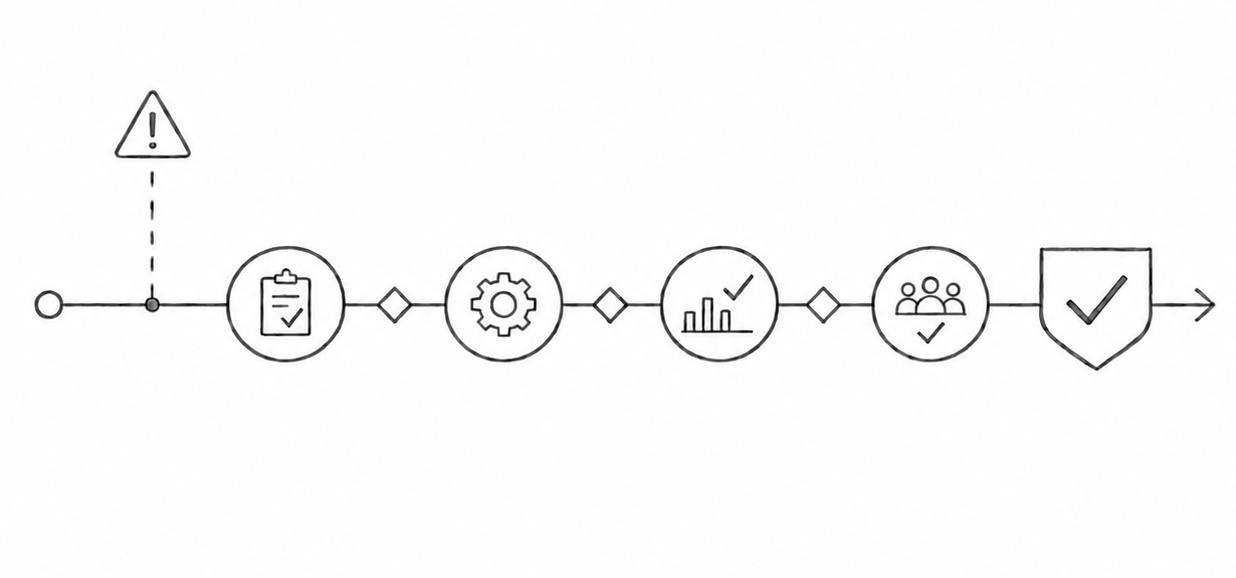
Is release confidence built into the system?
Are issues identified early enough to resolve safely?
Does late stage rework signal upstream gaps?
Is industrialisation confidence visible before release?
Are release decisions based on objective criteria?
Is delivery reliability improving or degrading?
Can the organisation commit confidently under pressure?
Confidence is earned through structure, not optimism.
05

STRUCTURAL INTERPRETATION
What these patterns often indicate
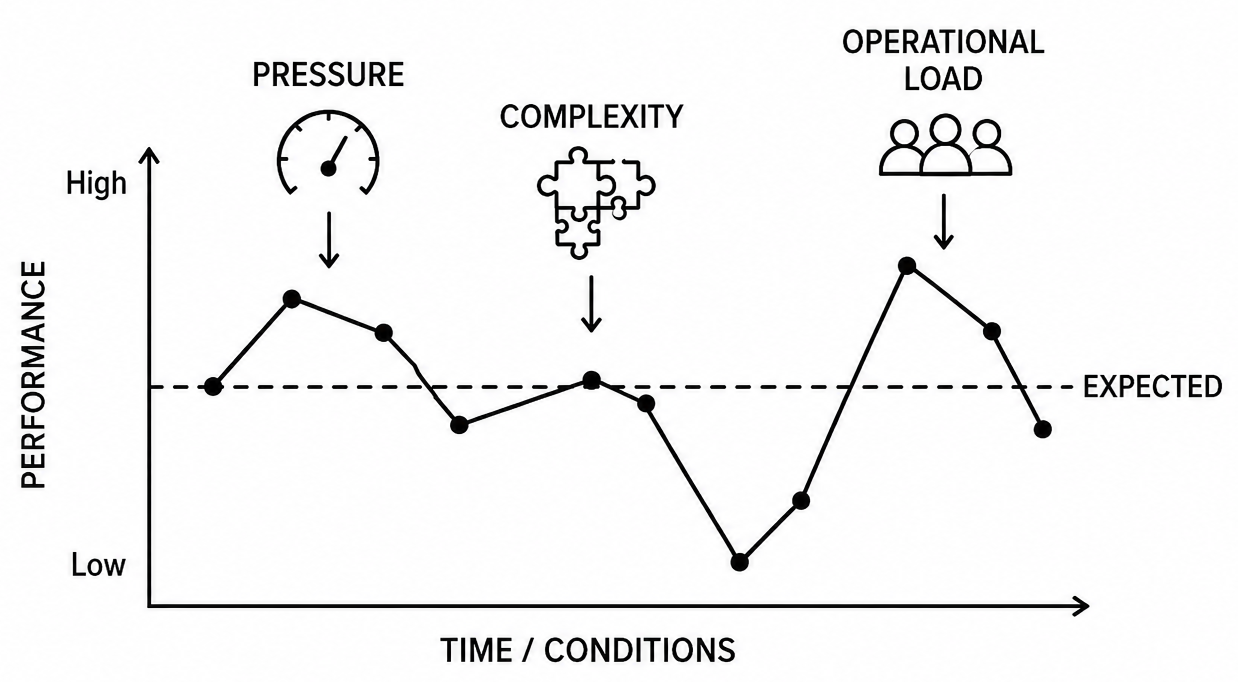
Delivery instability
Performance varies with pressure, complexity and operational load rather than remaining structurally stable.
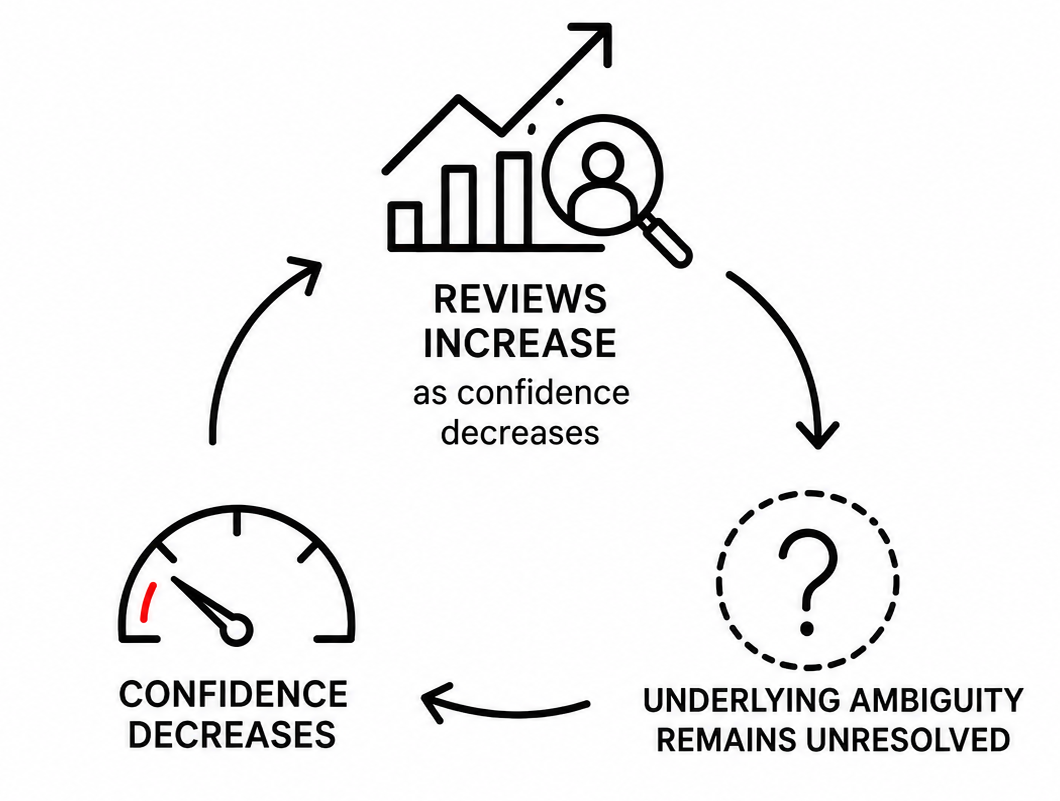
Review overload
Reviews increase as confidence decreases, but underlying ambiguity remains unresolved.
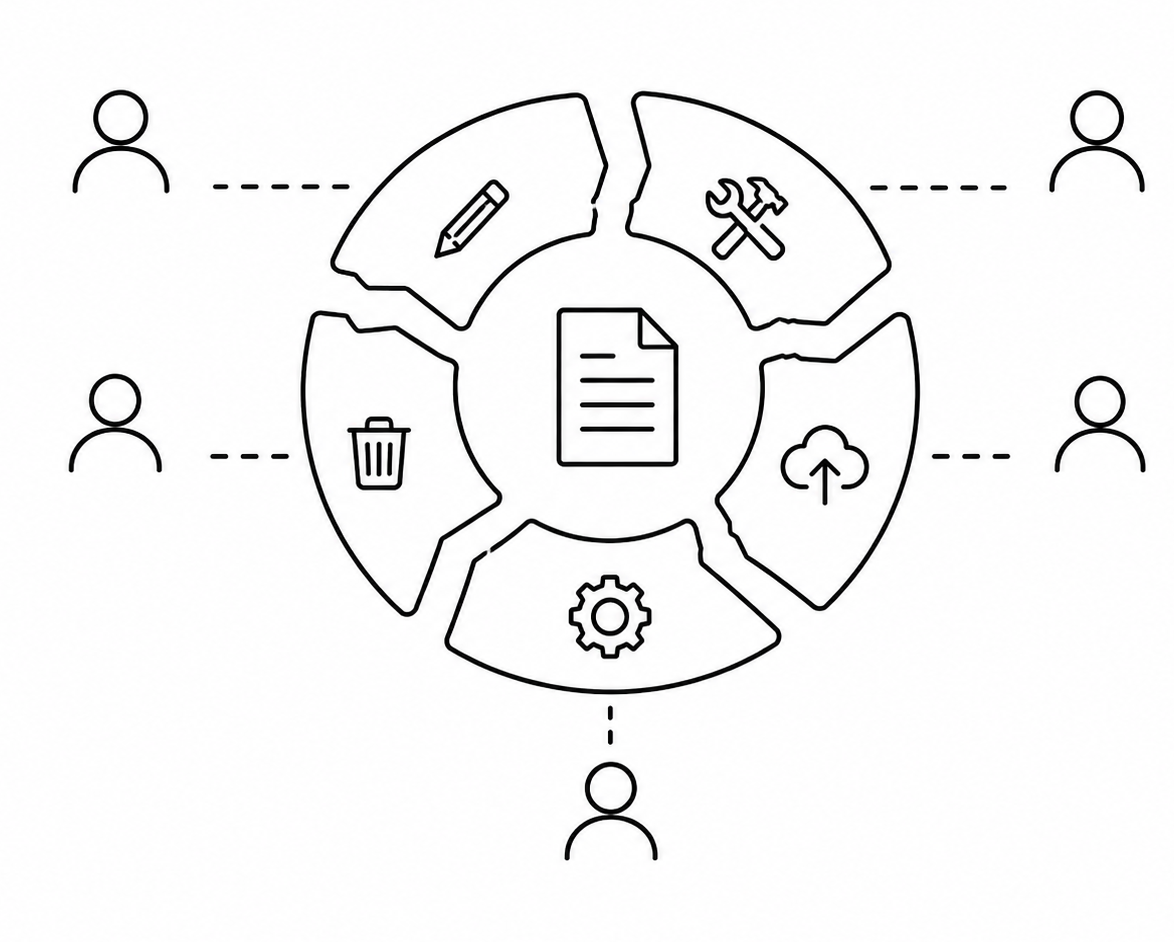
Fragmented ownership
Accountability gaps emerge between lifecycle stages, functions and operational interfaces.
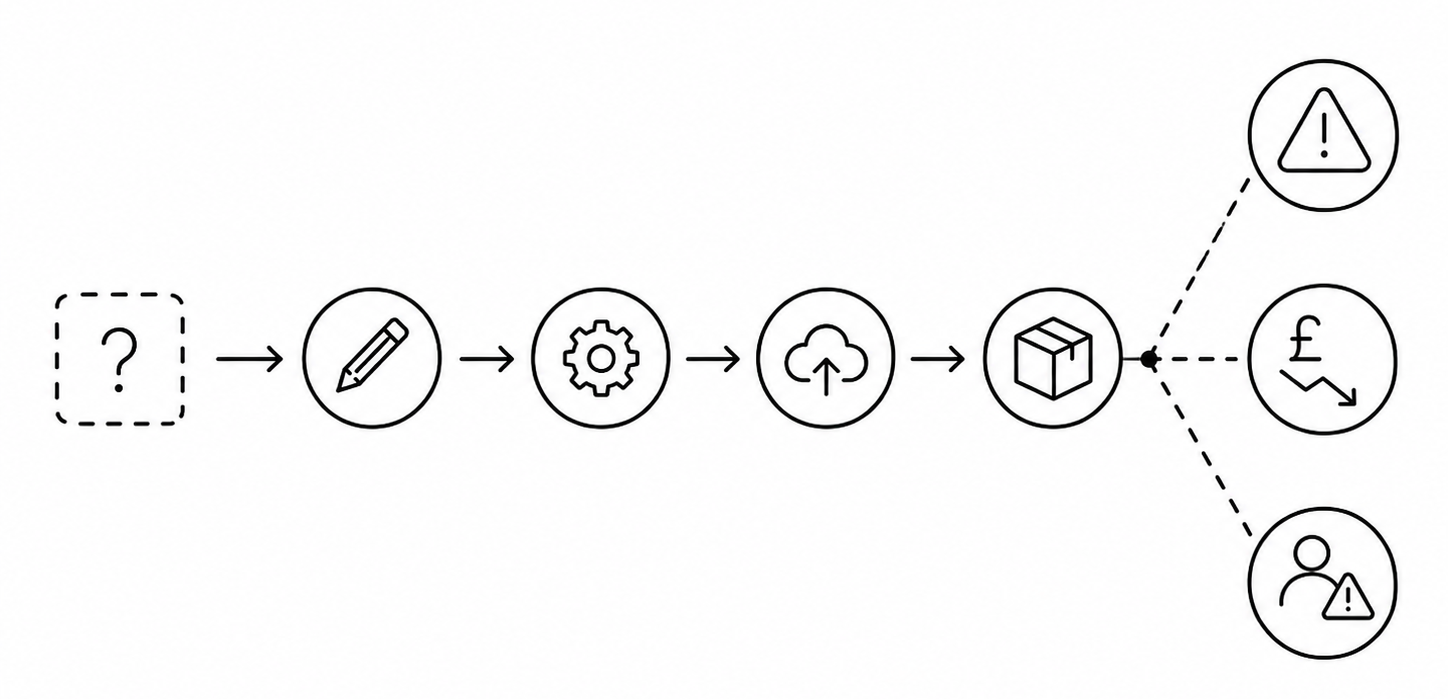
These patterns are rarely isolated. They reinforce each other and compound as complexity increases.
Downstream risk
Unresolved uncertainty moves through the system until it becomes operational, financial or customer risk.

Designing operating systems that scale with complexity
We work with boards and executive teams to strengthen the operating structures that govern delivery, escalation, ownership and decision confidence across complex engineering environments.
This includes aligning operational cadence, lifecycle governance, functional coordination and release confidence to the realities of modern engineering execution.
Confidential. No obligation. Executive-level discussion.